Table of Contents
Fielded vs Goal ProgressAdjusted CompletesTotal CostsCPILOIincidence Rate (IR)Watch VideoThis article covers how to review the Key Survey Metrics in the platform.
When you first open your project to manage, you will see the following key metrics to your survey.
Fielded vs Goal Progress
Shows how many completes are currently captured vs the intended goal
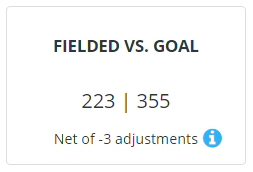
Adjusted Completes
Highlights any completes which have been adjusted
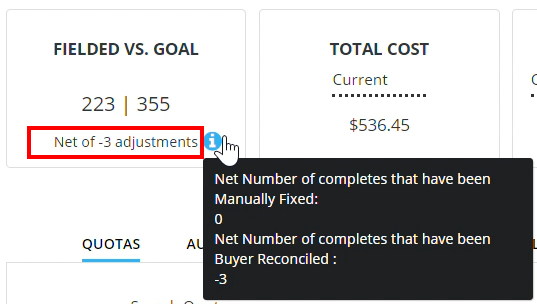
If you hover over the "i", this will show the net number of completes that have either been manually fixed or have been reconciled by the buyer.
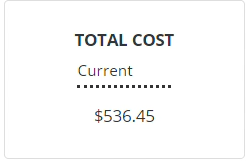
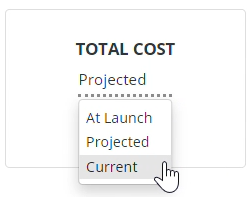
Total Costs
Shows three different costs for the project
| Cost Type | What it Shows |
|---|---|
| At Launch | Original CPI X goal number of completes |
| Projected | ((Goal Completes - Fielded Completes) X Current Avg CPI) + Current Costs |
| Current | The total costs of the project at the current time |
CPI
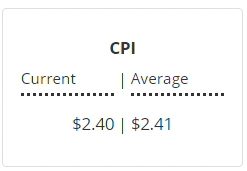
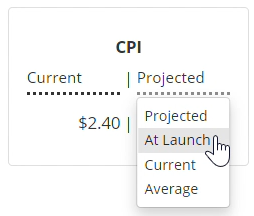
| CPI Type | What it Shows |
|---|---|
| Projected | (Projected Costs + Current Costs) / Goal Completes |
| At Launch | Original CPI provided at Launch or CPI entered in operator override section |
| Current | Current CPI entered in operator override section or Average CPI if not using price override |
| Average | Sum of (each CPI X each complete) / current completes |
LOI
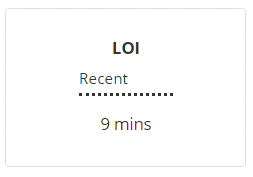
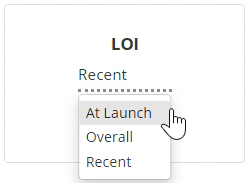
| LOI Type | What it Shows |
|---|---|
| At Launch | Length of Interview entered during setup |
| Overall | Median LOI of all respondents |
| Recent | LOI of the most recent block |
incidence Rate (IR)
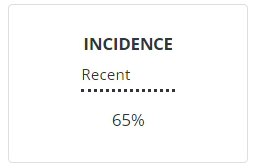
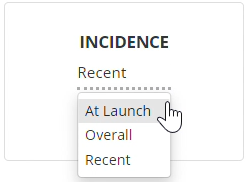
| Incidence Type | What is Shows |
|---|---|
| At Launch | Incidence Rate entered during setup |
| Overall | Completes / Valid Clicks |
| Recent | IR of the most recent block |