We have filtering options that can be applied to your charts very easily.
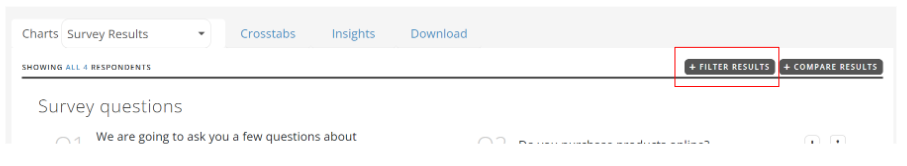
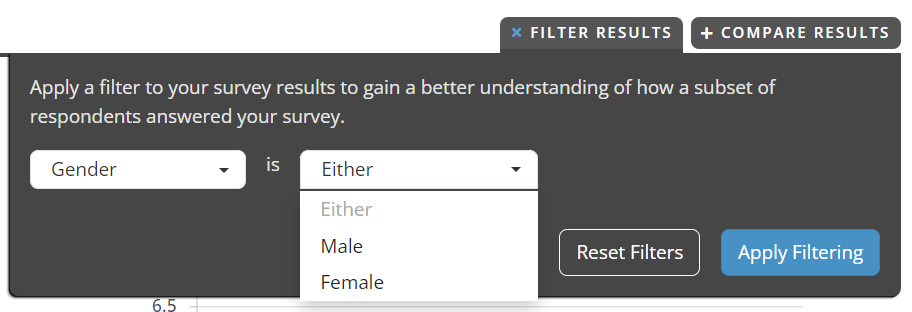
Step 1: Click on the ‘+ Filter Results’ button
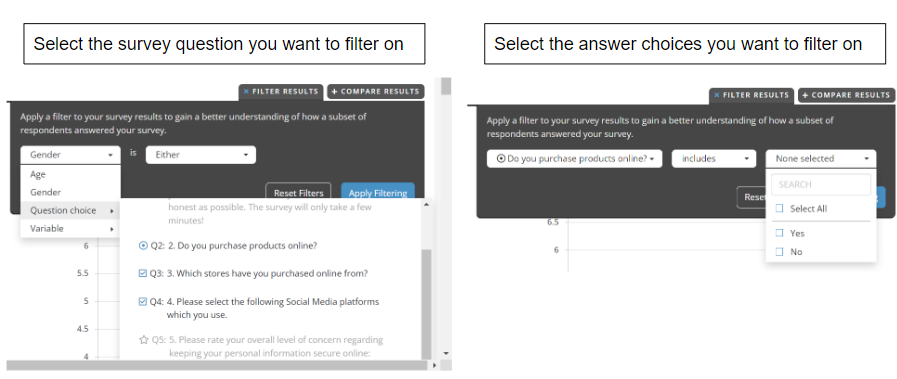
Step 2: Select the criteria you wish to filter on
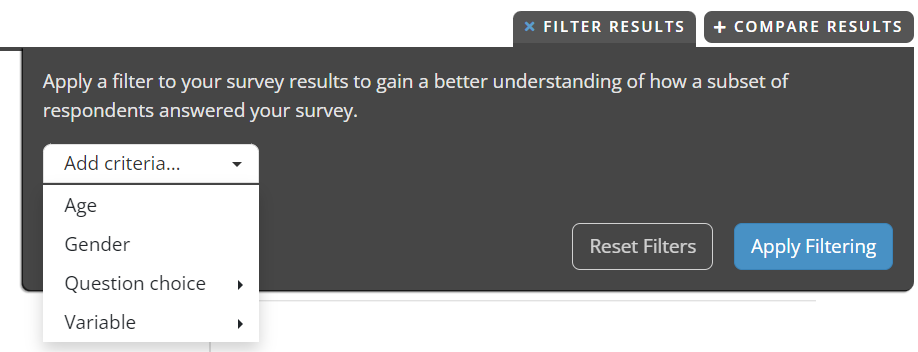
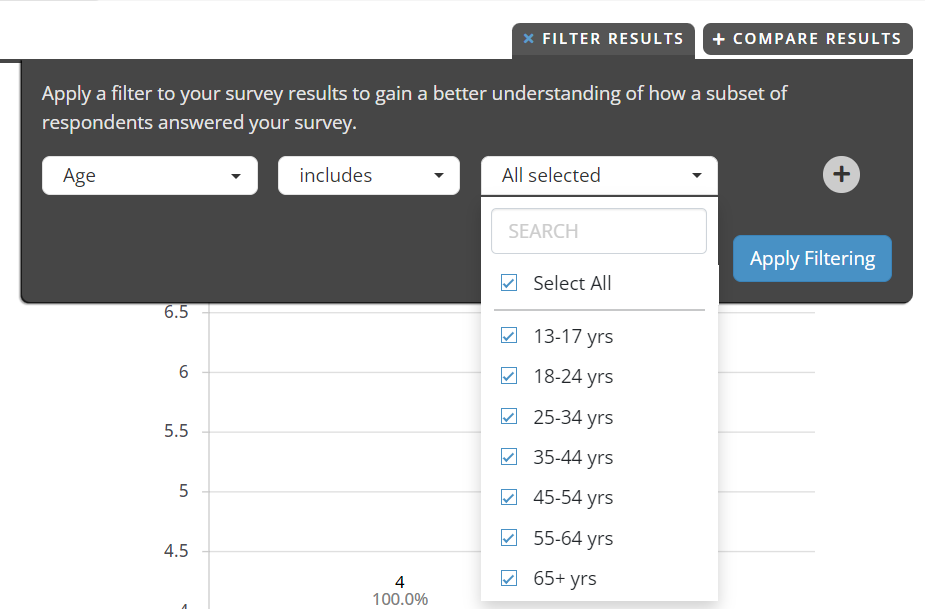
- Age: Select the age ranges you wish to filter on
- Gender: Select from Male or Female
- Question Choice:
- Variable:
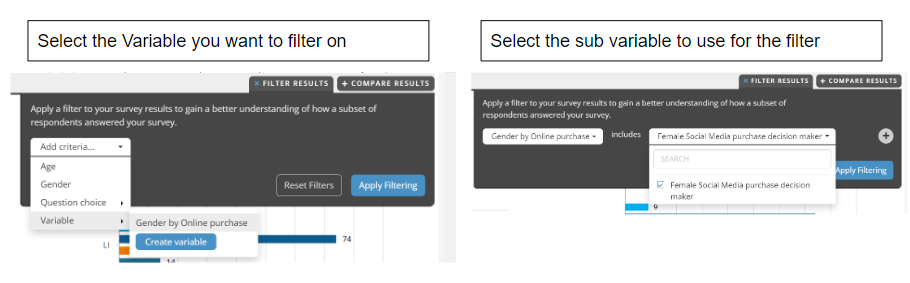
Note: Click here for a guide to 'Create Variable'
Step 4: Click on ‘Apply Filtering’ to see the charts based on the filters you selected
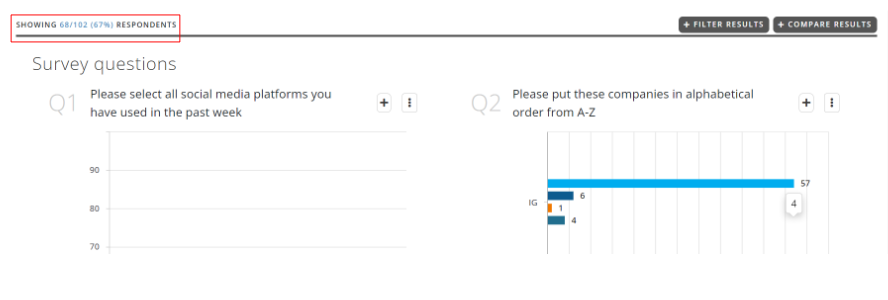
Step 5: After applying the filter the number of respondents will update and your charts will update to be based on the filter applied.