Health Check
The “Health Check” feature is an additional survey tab that tracks project health by monitoring various survey performance factors/KPI’s and provides a quick visual snapshot of a survey's health and progress through Green (Healthy), Yellow (Declining), and Red (Needs Attention) statuses.
Health Check also provides common solutions to improve fielding for any unhealthy performance statuses.
Gaining Access
Health Check is a feature that must be enabled on an account. Please reach out to your Account Manager if you are interested in adding this feature or are having trouble accessing the feature.
Health Check Location
Survey Dashboard
You can view any survey's Health Check tab by
- Clicking into a survey
- Clicking on the “Health Checks” tab

Account Dashboard
You can now view each a summary of each survey's Health Check statuses on your account dashboard by enabling “Health Check” through the Dynamic Dashboard feature.
- Click the Dynamic Dashboard gear icon (⚙️) after the rightmost dashboard header
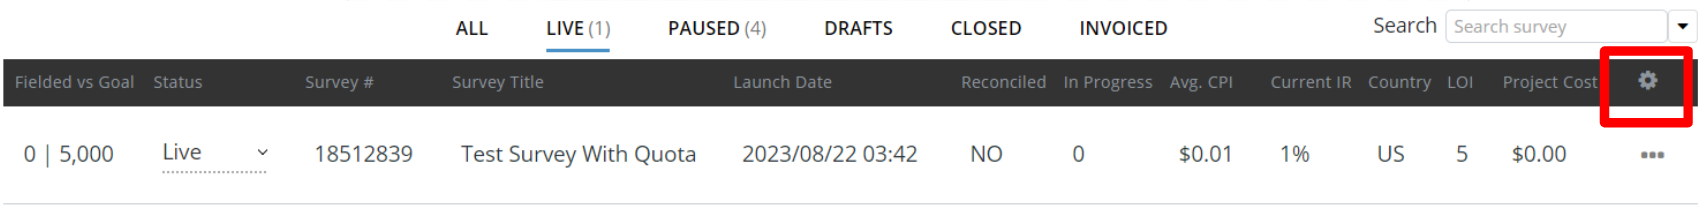
- Click to include Health Check onto the dashboard

Once enabled you should see the “Health Check” column. This column will denote the number of Health Check metrics that are in each color status (Green (Healthy), Yellow (Declining), and Red (Needs Attention)).

Click on the arrow to see a summary of exactly which metrics are which color status. You may also click “See more in Details” to be directed to the survey's Health Check tab.

Health Check Monitored Performance Factors
Currently Health Check monitors the following performance factors:
| Metric Name | Performance Factor | Commonly Identified Issues |
|---|---|---|
| Buyer Drop Rate | Percentage of respondents registering as a Buyer Drop |
|
| Buyer Over Quota | Percentage of respondents registering as an OverQuota |
|
| Completes per Hour | Number of completes per hour |
|
| IR Delta | Change in inputted IR vs recent IR |
|
| LOI Delta | Change in inputted LOI vs recent LOI |
|
| PS Status Ratio | Percentage of respondents terminating on the PureSpectrum Pre-Screeners |
|
| Supplier Dominance | Largest percentage of respondent completes by one supplier |
|
| Too Good to be True | Largest percentage of respondent conversion by one supplier |
|
| Pace | Compares the region's average amount of hourly traffic to actual survey completes over the projected field time. |
|
Current Status Thresholds:
| Metric Name | Yellow Status | Red Status |
|---|---|---|
| Buyer Drop Rate | 20-40% of Valid Clicks | 40%+ of Valid Clicks |
| Buyer Over Quota | 10-20% of Valid Clicks | 20%+ of Valid Clicks |
| Completes per Hour | 1 Complete | 0 Completes |
| IR Delta | Negative 10-20% | Negative 10%+ |
| LOI Delta | Positive 5-10 Minutes | Positive 10+ Minutes |
| PS Status Ratio | 25%-50% of Clicks | 50%+ of Clicks |
| Supplier Dominance | 40%+ of sample from 1 supplier | |
| Too Good to be True | 10-20% difference in IR VS supplier average | 20+% difference in IR VS supplier average |
| Pace | 20-40 Completes behind Expected | 40+ Completes behind Expected |